







 Download Free Sample
 Buy Now
Market Size
The global graphite market is projected to expand from USD 21.05 billion in 2026 to USD 35.5 billion by 2035, registering a CAGR of 5.98% during 2026-2035. Growth is due to the accelerating demand for battery-grade graphite in lithium-ion cells, consistent uptake in industrial refractories, and the expansion of electric vehicles and hybrid vehicle manufacturing. Natural and synthetic graphite producers are expanding capacity to meet rising demand from energy storage, metallurgy, and high-performance materials.

See What’s in the Full Report - Request Your Complimentary Insights!
Key Takeaways
- Synthetic graphite is expected to command the majority share by 2035 due to its performance consistency, high purity, and suitability for battery anodes.
- Natural graphite demand is growing rapidly as EV OEMs diversify supply away from China and invest in spherical graphite processing in North America and Europe.
- Refractories remain the largest application segment due to steel production requirements, while battery-grade graphite is the fastest growing segment.
- The metallurgy industry continues to anchor long-term consumption owing to persistent steel and foundry demand.
- EV and energy-storage manufacturers are signing long-term supply agreements to secure high-quality anode material ahead of capacity expansions.
- Supply-chain volatility, including geopolitical restrictions and environmental permitting constraints, remains a key structural bottleneck.
- Asia Pacific holds the largest regional market share, supported by China’s leadership in both synthetic graphite production and battery gigafactory capacity.
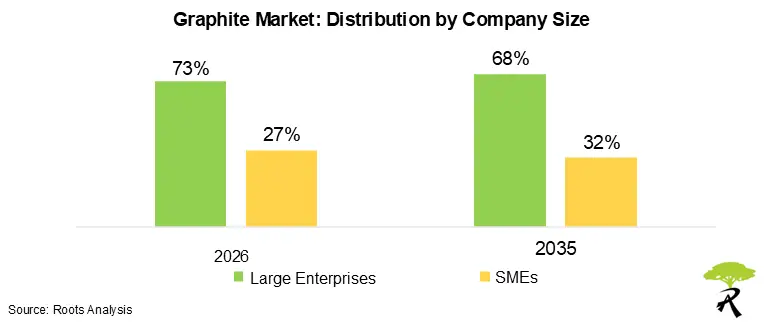
- SMEs are scaling faster due to niche processing capabilities, purified graphite technologies, and growing participation in localized supply chains.
- Investment momentum is supported by global policy incentives targeting domestic battery-material production, including the US Inflation Reduction Act and EU Critical Raw Materials Act
Access Exclusive Insights - Request Your Free Sample Today!
Market Overview
Graphite is a critical industrial material valued for its high thermal conductivity, structural stability, chemical inertness, lubricating properties, and excellent electrochemical behavior. These attributes underpin its use across refractories, steelmaking, foundries, friction products, and specialty industrial applications. The most significant growth driver in the coming decade is its role as the dominant anode material in lithium-ion batteries, where both natural and synthetic graphite remain indispensable for EVs, energy storage systems, and consumer electronics.
The transition toward electrified transportation, supported by aggressive global policy targets, is reshaping graphite supply chains. Battery manufacturers increasingly require high-purity spherical graphite, prompting new investments in purification, coating, and carbonization technologies. Synthetic graphite producers are expanding capacity to meet consistent anode-quality specifications, while natural graphite developers are upgrading mining and processing assets to produce battery-grade materials.
Beyond batteries, traditional industries remain key consumers. Refractories and metallurgy continue to absorb significant volumes due to graphite’s high-temperature resistance and structural performance in steel furnaces. In automotive and industrial manufacturing, graphite continues to be used in brake linings, clutch materials, lubricants, and friction products. As industrial electrification, renewable energy, and green-steel initiatives progress, graphite remains essential across multiple value chains.
Recent Developments in Graphite Market
Several recent developments have taken place in the market, some of which have been outlined below.
- In September 2025, Graphite One received a further indication of support and an LOI-level engagement from the US export-finance authorities for USD 570 million backing to develop Alaska’s Graphite Creek and associated AAM capacity
- In July 2025, POSCO Future M signed an anode-material supply contract with a major Japanese battery company as part of its strategy to commercialize domestically produced natural-graphite anodes and expand customer diversification.
- In June 2025, Lucid Group announced a multi-year natural graphite supply agreement with Graphite One for material from the Graphite Creek deposit (production expected to begin in 2028), aimed at securing US anode feedstock for Lucid’s battery suppliers.
- In May 2025, Titan Mining announced the launch of a processing facility to produce natural flake graphite concentrate (initial throughput ~1,000–1,200 tonnes/year concentrate target) to qualify product for US industrial and defense customers
- In October 2024, Syrah secured a DFC loan to overcome challenges in the graphite market amidst supply chain pressures.
- In October 2024, Northern Graphite partnered with Rain Carbon to become integrated mine-to-battery producer.
- In August 2024, Graphite One partnered with Lucid Motors for US domestic advanced graphite supply chain.
- In March 2024, OneD Battery Sciences and Koch Modular united for silicon-enhanced graphite anode plant.
Market Trends
- Battery anode demand is driving near-term upstream deals and domestic supply agreements. Lucid’s 2025 multi-year supply agreement with Graphite One and Graphite One’s progress on the US permitting show OEMs securing local natural graphite to de-risk China-centric supply chains.
- Producers and project developers win public finance and strategic loans to scale capacity outside China. Syrah’s multi-stage DFC financing and related US project planning illustrate how international development capital is targeting Balama output and US downstream capacity.
- Recycled and circular graphite technologies are moving from pilot to partnership stage. Aurubis and Talga’s collaboration on battery-grade recycled graphite signals credible progress toward lower-carbon anode feedstocks.
- Silicon-graphite and blended anode chemistries are scaling via industrial partnerships. OneD Battery Sciences’ alliance with Koch Modular aims to industrialize silicon-infused graphite anodes, reflecting the industry push for higher energy density anodes.
- Natural versus synthetic economics are diverging by use case and region. Synthetic graphite keeps favor where consistent purity and high throughput matter. Natural graphite remains competitive for spherical and coated anode markets when local processing and beneficiation lower total cost. Evidence comes from multiple regional supply deals and processing investments.
- Strategic partnerships are focusing on mine-to-anode integration to shorten value chains. Northern Graphite’s JDA with Rain Carbon and other integrated deals aim to move feedstock through purification and anode precursor steps to improve cell-level performance.
- Policy and procurement incentives accelerate domestic buildouts but raise permitting and ESG hurdles. The US IRA incentives and EU critical-raw-materials initiatives push investment into local graphite value chains while permitting and community risks (illustrated by site disputes) can delay project timelines.
- Legacy industrial demand remains stable and supports base-load consumption. Refractories, electrodes, and metallurgical uses continue to absorb large volumes, providing steady demand even as battery anode demand grows. Company capacity notices and business unit investment plans confirm this dual demand base.
Pay Only for What You Need – The Best Way to Optimize
Market Forecast Methodology
Overview of Approach
The forecast for the global graphite market through 2035 is built using a hybrid top-down and bottom-up model. The approach integrates macroeconomic indicators, sector-level demand drivers, mine-level supply capacity, and verified industry disclosures. All assumptions are cross-checked against trusted secondary sources, including USGS mineral summaries, IEA energy-storage outlooks, OEM filings, gigafactory announcements, and trade statistics.
Data Inputs and Assumptions
The model incorporates historical production of natural and synthetic graphite, purification and spherical graphite capacities, Li-ion battery GWh pipelines, EV sales forecasts, steel and EAF output trends, refractory production, and industrial activity indices. It also includes corporate disclosures on capacity expansions, feasibility studies, mine commissioning timelines, and synthetic-graphite cost structures. Major policy drivers, such as the US Inflation Reduction Act, EU Critical Raw Materials Act, and China export controls are treated as demand-shaping variables.
Top-Down Forecasting
Macroeconomic variables (GDP, industrial output, EV penetration, battery manufacturing expansion) are converted into graphite intensity metrics. Examples include graphite demand per kWh for anodes, electrode demand linked to EAF steel production, and refractory usage tied to industrial production. This defines the upper boundary for sectoral demand.
Bottom-Up Forecasting
Supply-side modelling evaluates each natural graphite project by development stage and probability of commissioning, while synthetic graphite output is estimated using needle-coke availability, energy costs, and announced expansions. Demand-side modelling calculates anode material requirements using GWh capacity x graphite per kWh, adjusted for chemistry shifts, while non-battery uses rely on historical consumption ratios and sector-level growth rates.
Scenario Modelling
Three scenarios: Base, Optimistic, and Conservative test sensitivity to EV growth, gigafactory ramp-up, supply delays, policy changes, and feedstock constraints. Project probabilities and graphite-per-kWh assumptions are adjusted accordingly.
Validation and Cross-Checks
Outputs are validated using automaker battery plans, gigafactory construction updates, steel industry production forecasts, import–export patterns, and historical tightness cycles. Outliers are corrected using conservative weighting.
Further, natural flake, spherical, and synthetic graphite prices feed into utilization assumptions, influencing near-term capacity decisions and supply tightness. Forecasts run annually to 2035, with update cycles triggered by major policy announcements, supply-chain shifts, or significant project milestones.
Your Business is Unique - Why Shouldn't Your Report Be?
Market Segmentation Analysis
By Product Type (Natural vs Synthetic)
Synthetic graphite captures preference where consistency, high purity, and controlled electrochemical performance are critical, notably for engineered anodes and industrial electrodes. Natural graphite remains strategically important for spherical-graphite supply chains where localized beneficiation and coating can lower cell-level costs. Producers vertically integrating purification and coating improves competitiveness for battery OEMs.
By Application (Battery Anodes, Refractories and Electrodes, Others)
Battery anodes drive incremental demand and are the principal growth vector; project-level offtakes and gigafactory pipelines materially influence near-term capacity decisions. Refractories and electrode markets act as demand stabilizers, absorbing material during cyclical slowdowns in battery buildouts. Niche uses (lubricants, friction, foundry) provide margin opportunities for specialty graphite grades and downstream processors.
By End-User (Automotive & EVs, Metallurgy, Electronics, Others)
EV and battery cell manufacturers set procurement timetables that cascade upstream; OEM supply agreements and long-lead offtakes are the dominant commercial signal for new capacity. Metallurgy and foundry customers prioritize high-temperature performance and long-term contracts, which underpin base-load demand independent of battery cycles. Additionally, electronics and specialty industrial buyers value ultra-high-purity and traceability, benefiting vertically integrated suppliers.
By Company Size (Large OEMs vs SMEs)
Large integrated suppliers retain advantage on scale, certification, and long-term offtakes with automakers and steelmakers. SMEs compete on agility: rapid adoption of recycling, pilot-scale coated-spherical processes, and regional supply deals that address near-term procurement risk and local content rules. Public-private financing (DFC, DoD awards) often tilts viability for mid-tier developers targeting domestic anode supply.
By Region (Supply vs Demand Dynamics)
Asia remains the dominant demand and production hub for both synthetic and natural graphite processing; China’s processing scale is the global fulcrum, while new Western projects aim to diversify supply. North America and Europe show rapid policy-driven buildouts for domestic anode and purification capacity, evidenced by multi-year supply agreements and project financing. Emerging production in Africa, South America, and Southeast Asia will continue to matter for feedstock, but value capture depends on local processing and ESG compliance.
Graphite Market: Scope of the Report
| Key Report Attributes | Details | |
| Historical Trend | Since 2019 | |
| Forecast Period | 2026-2035 | |
| Market Size Value in 2026 | $ 21.95 Billion | |
| Market Size Value by 2035 | $ 35.50 Billion | |
| CAGR (Till 2035) | 5.98% | |
| Type of Product |
|
|
| Areas of Application |
|
|
| Type of End-Users |
|
|
| Company Size |
|
|
| Geographical Regions |
|
|
| Leading Market Players |
|
|
| PowerPoint Presentation (Complimentary) | Available | |
| Customization Scope | 15% Free Customization | |
| Excel Data Packs (Complimentary) |
|
|
Have Questions? Let’s Get Them Answered.
Market Segments
Overall graphite market has been distributed across following market segments.
Type of Product
- Natural
- Synthetic
Areas of Application
- Battery Production
- Electrodes
- Foundries
- Friction Products
- Lubricants
- Recarburizing
- Refractories
- Others
Type of End-Users
- Automotive (including EV/HEV Vehicles)
- Electronics
- Metallurgy
- Others
Company Size
- Large Enterprises
- Small and Medium Enterprises
Geographical Regions
- North America
- US
- Canada
- Mexico
- Other North American countries
- Europe
- Austria
- Belgium
- Denmark
- France
- Germany
- Ireland
- Italy
- Netherlands
- Norway
- Russia
- Spain
- Sweden
- Switzerland
- UK
- Other European countries
- Asia
- China
- India
- Japan
- Singapore
- South Korea
- Other Asian countries
- Latin America
- Brazil
- Chile
- Colombia
- Venezuela
- Other Latin American countries
- Middle East and North Africa
- Egypt
- Iran
- Iraq
- Israel
- Kuwait
- Saudi Arabia
- UAE
- Other MENA countries
- Rest of the World
- Australia
- New Zealand
- Other countries